Charlotte Gisbourne, market analyst at PV Tech Research discusses trends and movements in the Q1 2025 edition of the Battery StorageTech Bankability Ratings report.
The latest release of the Battery StorageTech Bankability Ratings report has been completed with forecasts out to the end of 2025, taking into account each supplier’s current operations and full-year estimated performance.
Enjoy 12 months of exclusive analysis
- Regular insight and analysis of the industry’s biggest developments
- In-depth interviews with the industry’s leading figures
- Annual digital subscription to the PV Tech Power journal
- Discounts on Solar Media’s portfolio of events, in-person and virtual
Or continue reading this article for free
Although geopolitical uncertainties are a constant threat, many countries are still pushing towards their energy storage goals, and it is predicted that 2025 will remain a strong year for energy storage systems (ESS) deployment and suppliers as a whole.
However, the decline in battery prices and increased competition could undermine this growth and suppliers should be looking towards cost-cutting measures if they want to remain financially sound.
In this article, the changes in the latest report release are evaluated and discussed, in addition to a review of the manufacturing landscape for 2025 and an exploration into the top bankable companies within the sector.
New companies reach AAA-Ratings status
With each new release of the report, the benchmarking analysis is re-assessed to accurately rank the overall bankability scores for the companies included.
One key change for Q1’25 is a reduction in the impact of end market concentration within the manufacturing score.
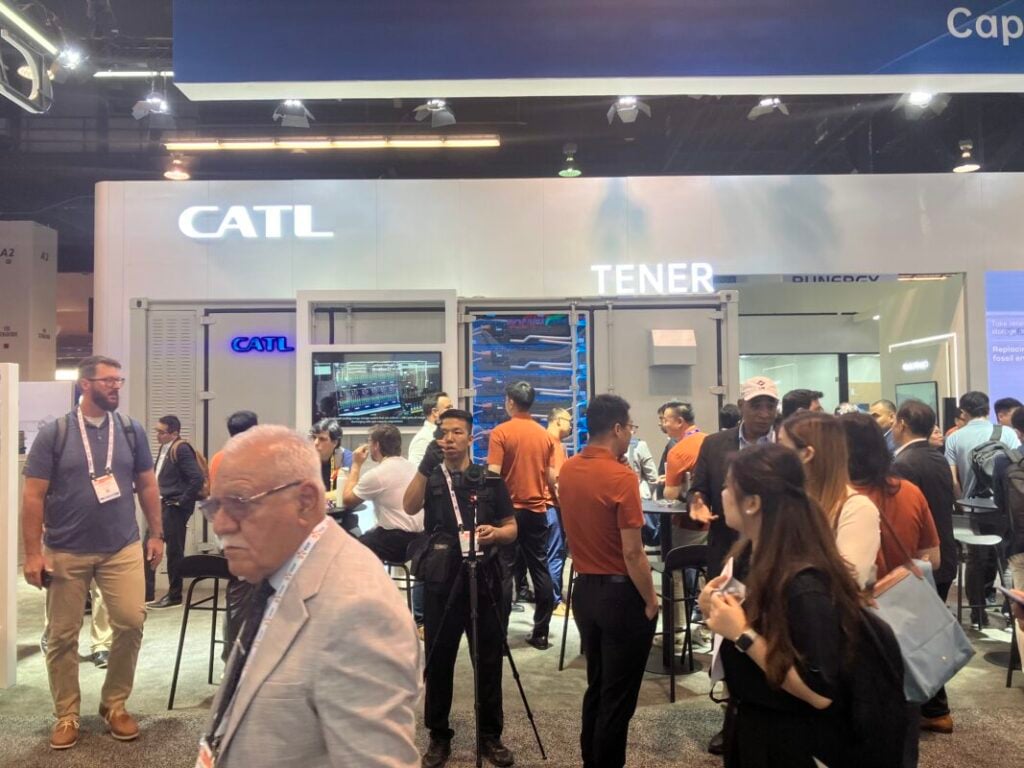
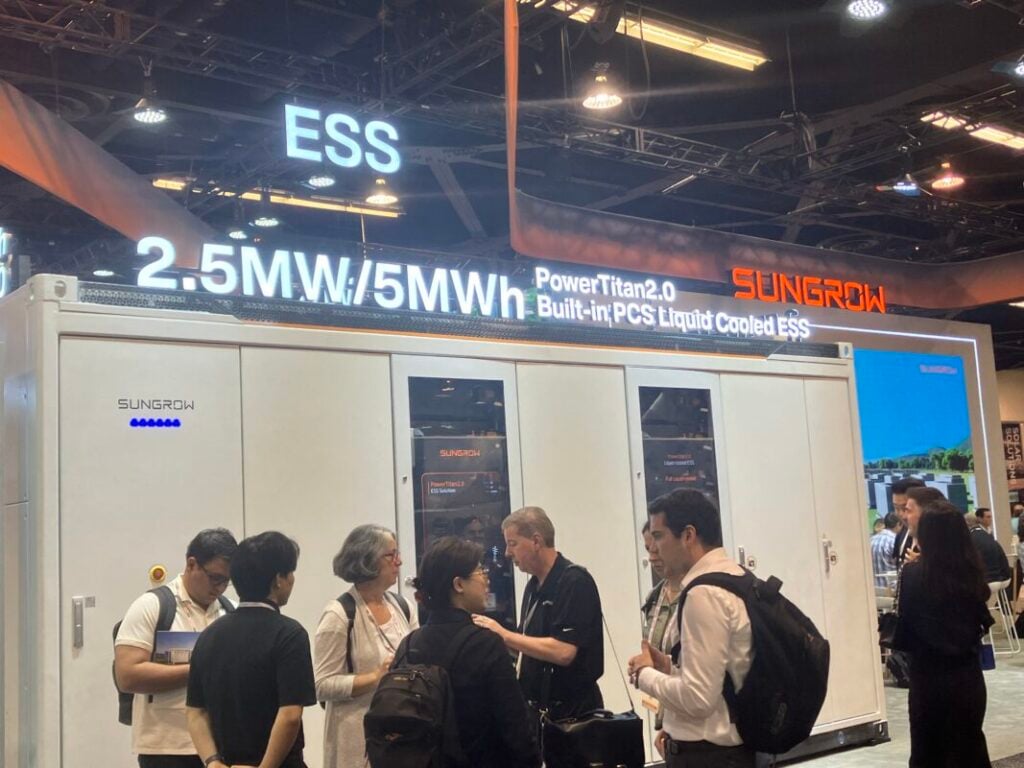
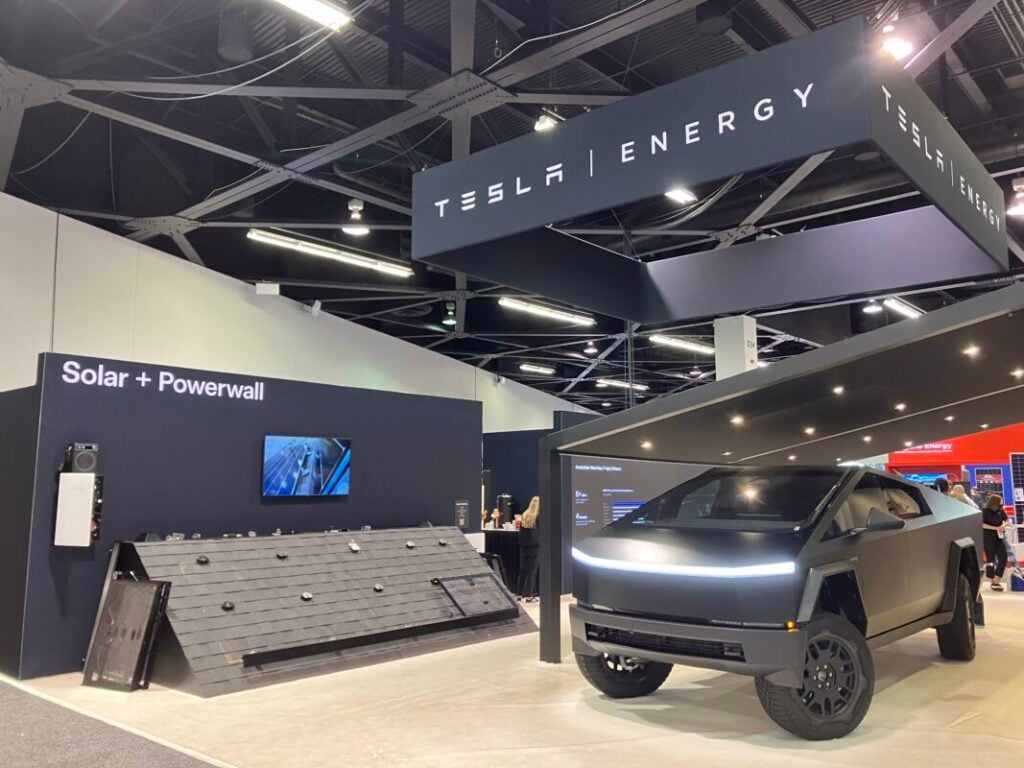
The majority of changes in bankability scores typically occur in the middle of the pyramid, in particular for companies close to the boundaries of the different rating bands. However, higher up in the pyramid, CATL and Sungrow have managed to climb to the premium AAA-rated band. Only Tesla has achieved AAA-rating status in the previous two editions of the report since its launch in Q3 2024.
Last year, CATL and Sungrow recorded very high shipment volumes and secured some large global supply deals, such as CATL with Grenergy in Chile and Sungrow’s 4.4GWh contract with Fidra Energy in the UK. While not all of the deals will result in deployments this year, this does nonetheless confirm sustained growth of the energy storage business for these companies.
Regarding the financials, Sungrow and CATL are forecast to see strong revenue growth this year and are at low risk of financial difficulties due in part to being in control of long-term debt and short-term cash flow.
Trends for the most bankable suppliers
The figures below show the percentage variation from the mean of the three companies with the highest bankability scores, to assess common operational trends.
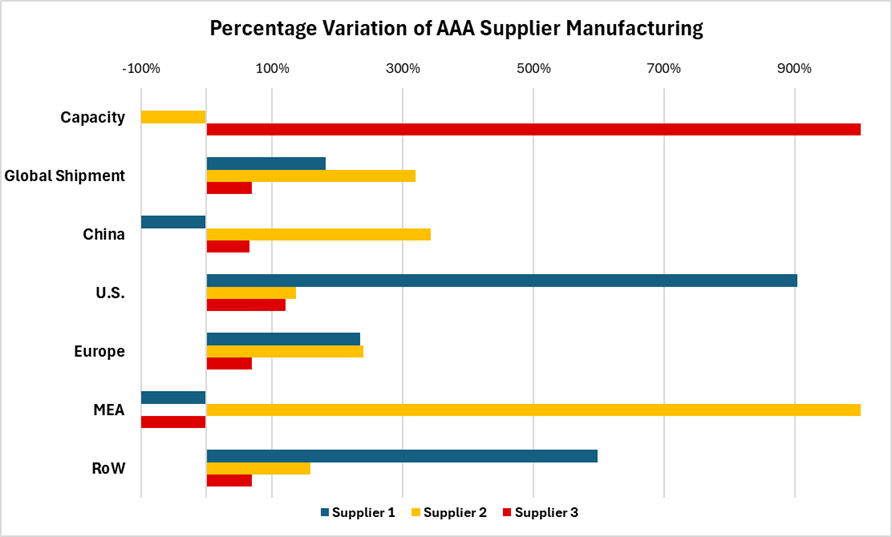
Looking at the top three ESS suppliers (AAA-Rated), there is significant variation regarding manufacturing, with one of the suppliers not having any cell production at all but excelling in system shipments.
While it could be expected that the leading companies have more system shipments than their competitors, Figure 1 above shows a clear regional divide between two of the companies. However, there is no single business model to become a leading AAA-Rated supplier; for example, the high production capacity figure for Supplier 3 (with lower shipments) highlights this company’s role as an OEM with the ability to capture a market-share in specific regions.
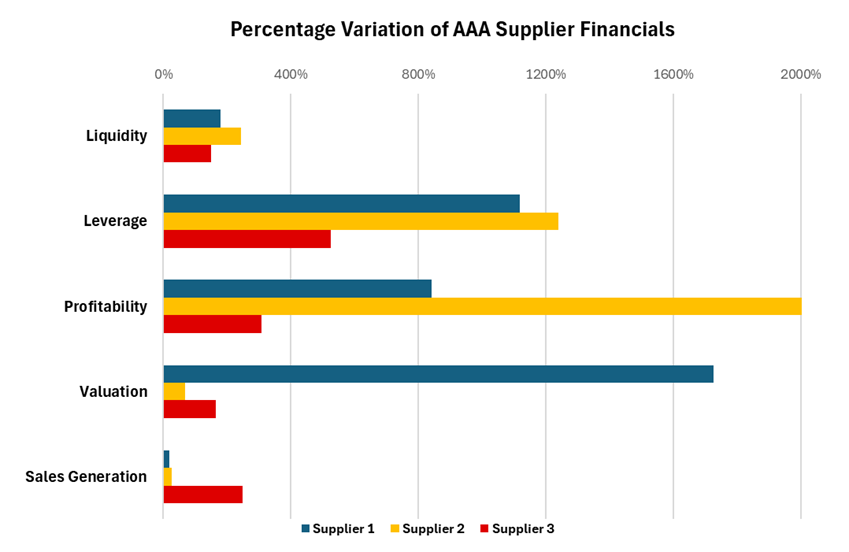
When comparing financial metrics, the three top companies have higher-than-average scores across all accounting ratios, particularly in leverage (long-term debt). This could simply be a consequence of being part of a larger entity, within which energy storage is not the main focus. The average ESS revenue share (as a percentage of group turnover) for these suppliers is typically less than 15%.
In general, these larger companies could be seen as more attractive, as having an established track record —and diversified revenue streams—could provide a sense of security and reduced risk for buyers.
Overall, the top players in the market are unlikely to change in the short-term unless there is a drastic shift in the overall energy storage sector as a whole. Despite new suppliers routinely entering the market, it will not be easy for them to climb to the top immediately.
Manufacturing trends
The following figures now show consolidated representation of the companies in the report; that is, looking at the overall totals for all companies covered:
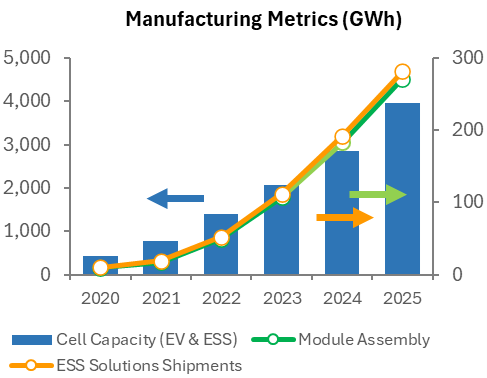
Despite the slowdown in the EV market last year, companies are still investing capital expenditure (capex) for capacity expansion purposes. Here, ESS is taking up a higher share of battery cell capacity (compared to overall EV and ESS battery cell capacity). This could be indicative of battery cell manufacturers attempting to hedge against a turbulent EV market landscape by expanding more into energy storage.
In 2024, 78% of the battery cell capacity for all suppliers in the report was located in China but there is certainly a growing trend for suppliers to invest in overseas production sites, particularly in Europe. One example here includes CALB’s factory in Portugal to access new opportunities in the region. There is also a push towards emerging markets such as the Middle East & Africa (MEA). This may be an effort by some to establish early mover advantage.
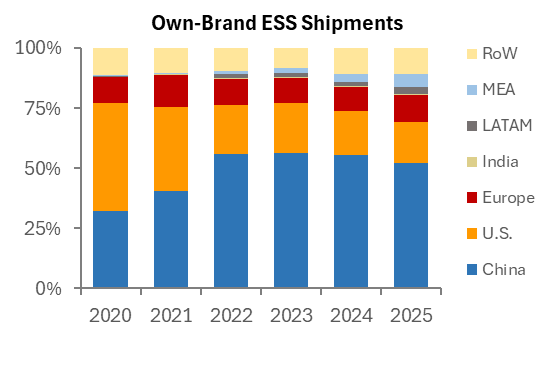
Despite an increased number of countries adopting ESS technology in 2025, it is nonetheless predicted that China will maintain its lead as the biggest end-market, driven by a strong policy framework and an established domestic supply-chain.
China also dominates lithium refining with several top cell manufacturers based in the region also, factors that should comfortably keep the country as the leading end-market in the near to mid-term. Although China is predicted to ‘lose’ market– share from a global deployment standpoint, this is mainly due to the growth in other regions and not a slowdown in China’s ambitions per se.
Emerging markets in the MEA region are predicted to achieve at least double the shipment volumes in 2025, compared to 2024. Larger ESS project sizes are common now in the MEA region, along with co-location. This should benefit companies in China offering both solar and ESS products, with the ability to bundle these solutions together.

In general, global shipment volumes for all suppliers are increasing year-on-year, with the average shipment volume per company rising by over 3GWh between 2024 and 2025.
However, there are signs of a gap widening between the companies in terms of product volumes. Unless a supplier has a specific niche, such as technology, it may be hard for new companies to break through into mainstream operations.
To learn more about the Battery StorageTech Bankability Ratings Report, or arrange a free demo, please contact our team.